

5-YEAR TCO BENCHMARK FOR FINANCE LEADERS
The hidden cost of building subscription billing in-house
Five-year TCO benchmark across 200+ SaaS finance teams. See where the hidden cost lives — and how leading CFOs decided to buy.

200+ SaaS finance teams benchmarked their build vs. buy decision


Where the hidden cost lives
Where the hidden cost lives
 Subscriptions
What in-house billing really costs finance teams
Launch subscriptions your way
Track every line item the build column hides — engineering hours, audit prep, dunning logic, integration glue, and the renewals nobody got around to recovering.
Grow revenue, minimize churn
Compare your in-house roadmap against a buy-side baseline. The 5-year delta averages $1.4M for finance teams between $20M and $200M ARR.
Scale as big as you want
Reclaim 12+ FTE-quarters per year that were funding billing maintenance and rerouting them to the roadmap your customers actually pay you for.
 Commerce
The build column nobody costs honestly
Audit prep alone consumes a quarter per year for in-house teams that haven't centralized contract data.
Missed renewals from incomplete dunning average 3.7% of MRR at the median in-house team — a number nobody puts on the build slide.
Feature drift compounds: every quarter a new edge case ships, and the roadmap to parity slips another sprint.
 Engage
Where dev time silently disappears
Engineering cost is the iceberg's tip — opportunity cost on the deferred roadmap is roughly 3x larger.
SOC, ASC-606, and IFRS-15 readiness fall to whoever last touched billing — usually the most senior engineer on the team.
Tax, fraud, and global payment method coverage age out faster than any team can patch them in-house.
 RevRec
How leading finance teams chose to buy
76% of teams who switched to Recurly named compliance time as their #1 reason — even ahead of dunning lift.
Median switch took 9 weeks; payback was under 7 months.
Audit cycles dropped 40% on average once revenue recognition stopped living in spreadsheets.
What in-house teams keep underestimating

Engineering cost (the visible line)
- Personalized acquisition and retention offers
- Real-time, in-product engagement
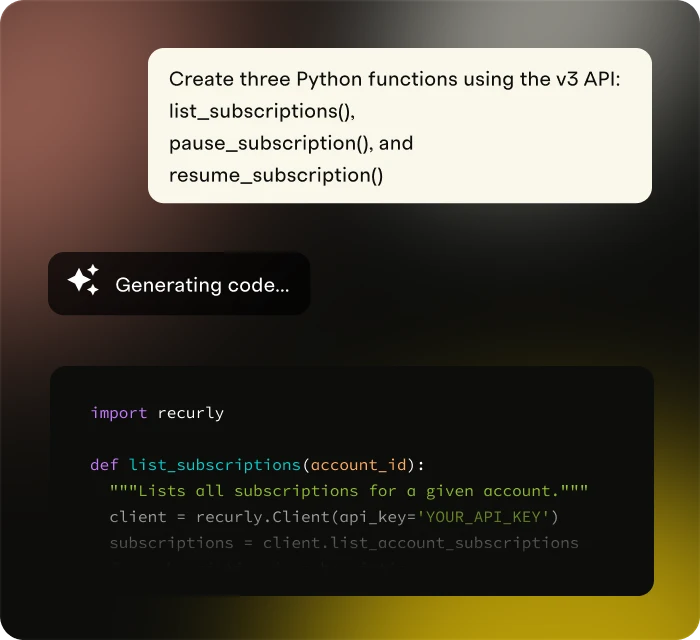
- AI-powered subscriber insights
Audit & compliance overhead
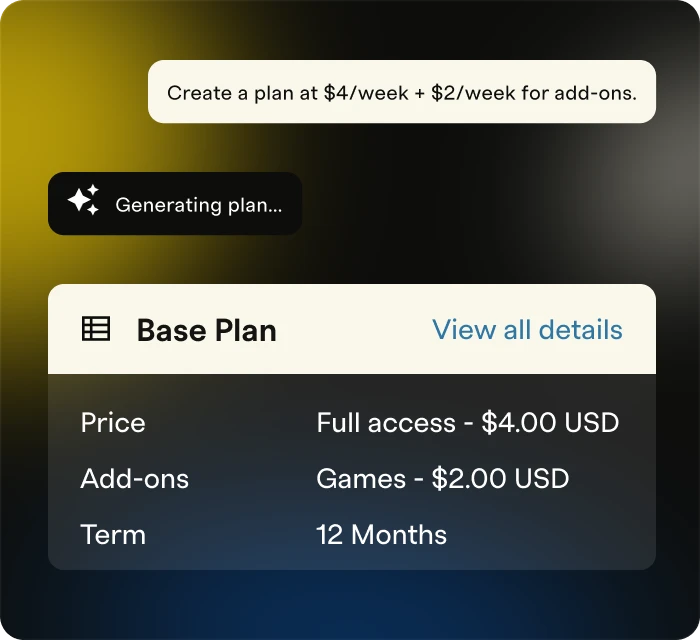
- Flexible plan launches and testing without engineering
- Personalized journeys with unified billing + engagement data.
- Built-in retention tools and insights to prove impact
Renewals quietly missed
- Secure platform for billing and payments
- Low-code plan management for faster launches
- Seamless integration with ERP, CRM, and data systems
Roadmap drift you'll never recoup
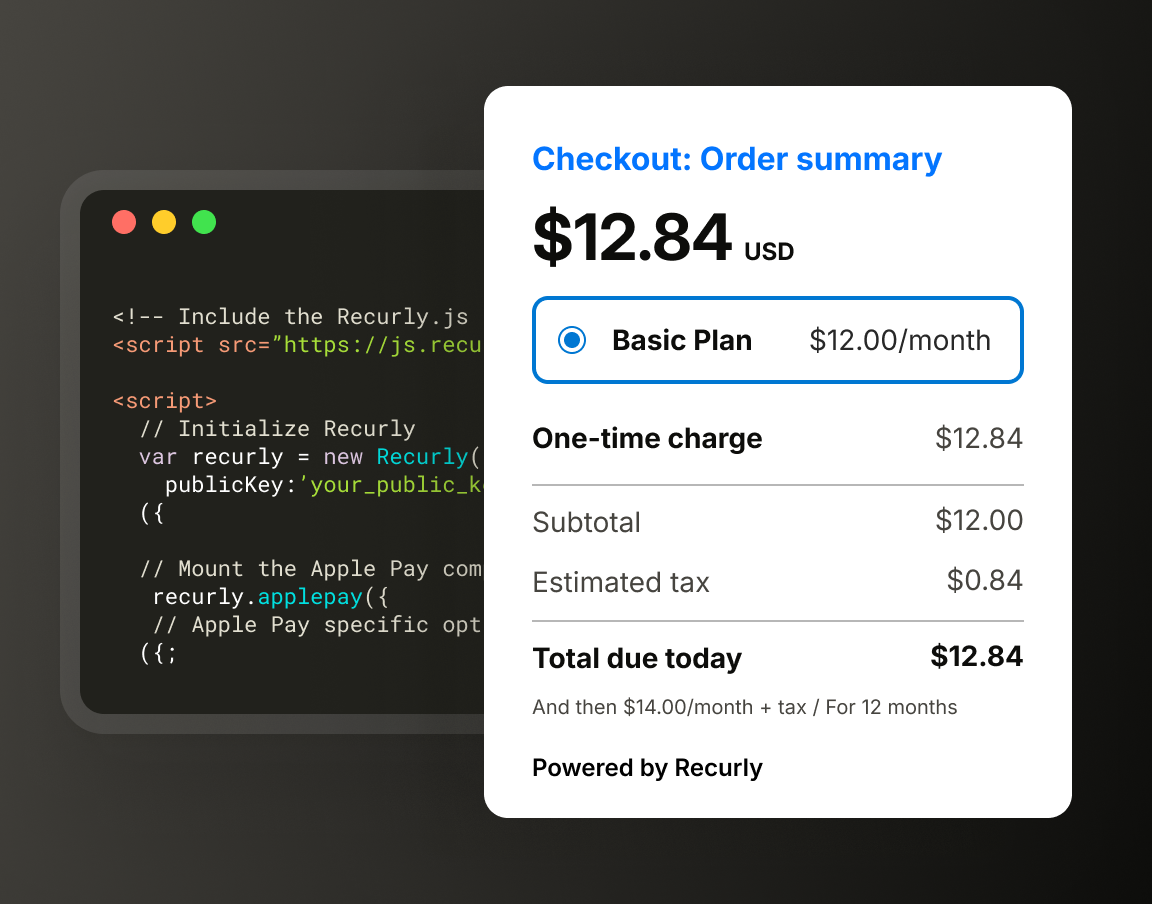
- Automated billing, invoicing, and recognition
- Smart revenue recovery tools that reduce churn
- Real-time reporting and forecasting
How the TCO benchmark was built
The cost of building, by the numbers
$1.4M
average hidden 5-year cost of building
200+
SaaS finance teams benchmarked
12+
FTE-quarters per year reclaimed
3.7%
of MRR lost to incomplete dunning
FROM THE TCO BENCHMARK
A clearer cost model for finance
Our TCO benchmark blends interview data from 200+ SaaS finance leaders with anonymized billing operations metrics. The result: a defensible build-vs-buy model your CFO can take into the room.
Configure instantly
Quantify the engineering hours, audit time, and missed renewals your current model is hiding.
Customize without coding
Compare your roadmap against the benchmark cohort to see where you're already paying the build tax.
Detect anamolies
Make the case in finance language: payback period, opportunity cost, and risk-adjusted NPV — not feature checklists.
The 2026 In-House Billing TCO report
A 5-year cost model built from 200+ SaaS finance teams, with line-by-line breakdowns of engineering, audit, dunning, and roadmap-drift cost — plus the questions to ask before you green-light another quarter of build:
- The “pause” dividend: How top merchants drove a 337% increase in pause usage to retain customers who would have otherwise canceled
- The AI-driven subscriber: Why 43% of consumers are now comfortable with AI managing subscriptions, especially for fraud prevention and content personalization
Download the full TCO benchmark to take a defensible build-vs-buy model into your next finance review.

Stop paying the hidden build tax
Get the 5-year TCO benchmark and see exactly where the in-house line items live.