

REVREC TCO BREAKDOWN
Spreadsheet RevRec is costing you a quarter
True total cost of ownership: spreadsheets vs. automated revenue recognition. Manual processes burn 8 to 12 FTE-quarters per year. The TCO breakdown shows where the time goes — and what 12 quarters back looks like.

Finance teams that traded spreadsheets for automated RevRec


What manual RevRec really costs
What manual RevRec really costs
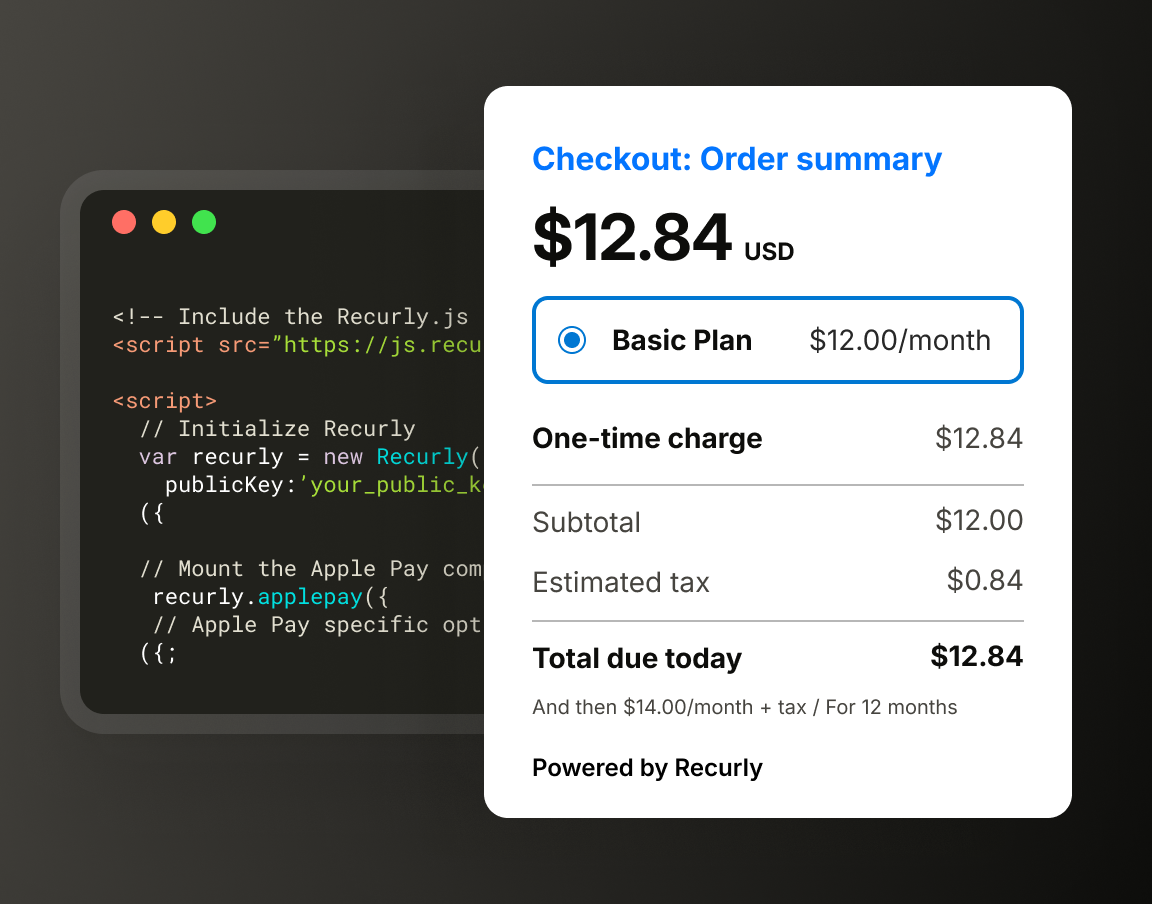
 Subscriptions
Where the FTE-quarters actually go
Launch subscriptions your way
Side-by-side TCO model: spreadsheet-based RevRec vs. automation, with every assumption you can plug your own numbers into.
Grow revenue, minimize churn
A breakdown of where 8-12 FTE-quarters per year evaporate inside spreadsheet RevRec — close, audit, reconciliation, and restatement-risk overhead.
Scale as big as you want
A worked example: roughly $680K of finance capacity reclaimed annually, a 4.2x three-year ROI, and 12 quarters back to focus on forecasting and analysis.
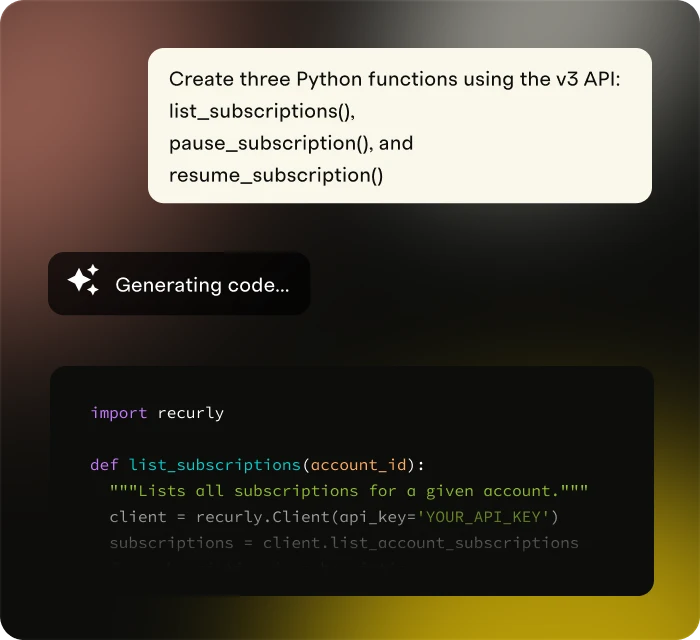
 Commerce
The 8-12 FTE-quarters lost to manual RevRec
Fully-loaded controller and senior accountant time at every step — pull, allocate, reconcile, audit — plus close-cycle delays, audit-fee impact, and the cost of restatement risk. The model walks line by line so you can plug in your own assumptions.
Mostly into manual reconciliations, building waterfall schedules contract by contract, and chasing audit samples. Together those activities consume 8 to 12 FTE-quarters per year — roughly an entire controller — at a 9-person finance org.
It's the average across mid-market subscription finance teams who replaced spreadsheet-based RevRec with Recurly. The TCO breakdown shows the underlying assumptions: reclaimed FTE capacity, faster close, lower audit fees, and reduced restatement risk.
 Engage
$680K of finance capacity, reclaimed
Manual reconciliation: the largest single line item in spreadsheet RevRec TCO — and the easiest to automate.
Audit prep: walkthrough docs, sample pulls, and disclosure tie-outs that disappear when revenue is reconciled and recognized in one system.
Restatement risk: the hidden cost of spreadsheet RevRec — the TCO breakdown puts a dollar value on it.
 RevRec
Three-year ROI: 4.2x on automation
A worked TCO comparison — fully-loaded FTE cost, close-cycle delay, audit-fee impact, and restatement-risk premium — for spreadsheet RevRec versus automation.
Where the 8-12 FTE-quarters actually go: reconciliation, contract waterfall builds, JE entry, and audit-sample chase work.
What 12 quarters back means: faster monthly close, audit-ready evidence on demand, and capacity to redirect senior accountants to forecasting and analysis.
Where the FTE-quarters go

Acquire and retain more
- Personalized acquisition and retention offers
- Real-time, in-product engagement
- AI-powered subscriber insights
Launch quickly, iterate often
- Flexible plan launches and testing without engineering
- Personalized journeys with unified billing + engagement data.
- Built-in retention tools and insights to prove impact
Simplify complexity, and scale securely
- Secure platform for billing and payments
- Low-code plan management for faster launches
- Seamless integration with ERP, CRM, and data systems
Automate compliance, improve forecasting
- Automated billing, invoicing, and recognition
- Smart revenue recovery tools that reduce churn
- Real-time reporting and forecasting
What 12 quarters back looks like

The TCO model, in three numbers
8-12
FTE-quarters/yr lost to manual RevRec
$680K
finance capacity reclaimed annually
4.2x
three-year ROI on automation
12
quarters back to your finance team
INSIDE THE TCO MODEL
Spreadsheets vs. automated RevRec
A side-by-side TCO model built from finance teams who replaced spreadsheet-based revenue recognition with Recurly. Manual processes burn 8 to 12 FTE-quarters per year. Automation reclaims roughly $680K of finance capacity and pays back 4.2x over three years.

Side-by-side TCO model
Spreadsheet RevRec vs. automated, line by line — fully-loaded FTE cost, audit fees, restatement-risk premium, and close-cycle delay.
FTE-quarter heatmap
Where the 8-12 FTE-quarters per year actually go — broken out by activity, role, and percentage of senior accountant time.
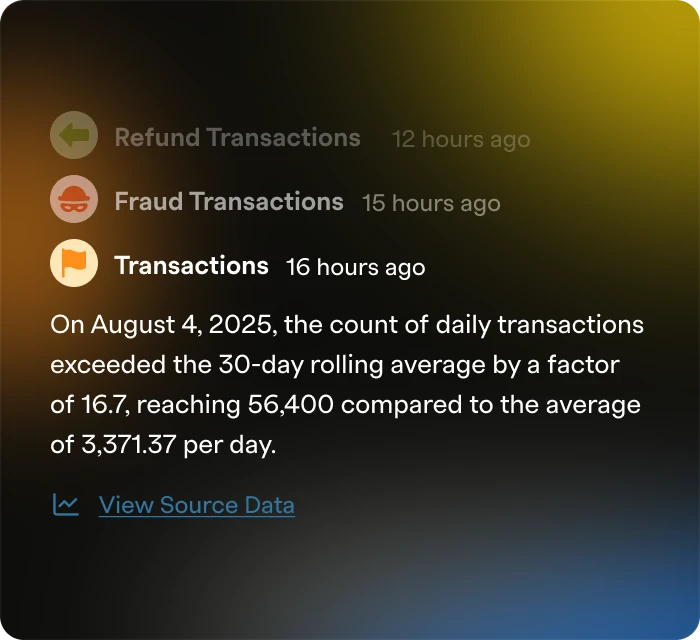
Detect anamolies
A worked ROI scenario showing $680K reclaimed and a 4.2x three-year ROI when finance leaves spreadsheets for automated RevRec.
Inside the TCO breakdown
A side-by-side TCO model — every line item, every assumption — for finance leaders weighing spreadsheet-based RevRec against automation. Includes:
- The 8-12 FTE-quarter problem: Where manual close, audit prep, and reconciliation work actually consume your controllers' calendars — line by line
- The $680K reclaim: A worked example showing how a 9-person finance org freed roughly $680K of capacity and a 4.2x three-year ROI by automating revenue recognition
Download the TCO breakdown to put a number on your spreadsheet quarter — and see what 12 quarters back would unlock for finance.

Get your team back a quarter
A side-by-side TCO model that puts a number on the spreadsheet quarter — 8-12 FTE-quarters/yr lost, ~$680K reclaimed, 4.2x ROI over three years.